
Consider the function $f$ defined by the equation
\[f(x)=\frac{4x^{2}-4}{2x-2}.\]
$f$ is defined for all values of $x$ except $x=1$, because substitution of $x=1$ in the expression for $f(x)$ yields the undefined fraction $\frac{0}{0}$. But because $4x^{2}-4=4(x^{2}-1)=4(x-1)(x+1)$, if $x\neq1$ we can simplify the fraction as
\[f(x)=\frac{4x^{2}-4}{2x-2}=\frac{4\cancel{(x-1)}(x+1)}{2\cancel{(x-1)}}=2x+2\qquad(\text{if }x\neq1)\]
So the graph of $f$ is the line $y=2x+2$ with one point removed, namely $(1,4)$. This point is shown as a hole in Figure 1.
 |
| Figure 1: Graph of $f(x)=(4x^{2}-4)/(2x-2)$ |
Now let’s investigate the values of $f$ when $x$ is close to 1 but not equal to 1. Let $x$ take on the values $0.9,0.95,0.99,0.999,0.9999$, and so on or take on the values $1.1,1.05,1.01,1.001,1.0001$, and so on. The corresponding values of $f$ are shown in the following table.

From this table and graph of $f$ shown in Figure 1, we see that as $x$ gets closer and closer to 1 (on either side of 1), but not equal to 1, $f(x)$ gets closer and closer to 4; the closer $x$ is to 1, the closer $f(x)$ is to 4. More specifically, we can make the values of $f(x)$ as close to 4 as we desire by taking $x$ close enough to 2. We express this by saying that “the limit of $f(x)$ as $x$ approaches $1$ is $4$” or simply “$f(x)$ approaches 4 as $x$ approaches 1,” or “$f(x)$ tends to $4$ as $x$ tends to $1$,” and express it symbolically as
\[\lim_{x\to1}f(x)=4\]
or
\[f(x)\to4\quad\text{as}\quad x\to1 \]
In general
Definition 1 (Unofficial Definition): If we can make the values of $f(x)$ as close as we please to a number $L$ by taking $x$ sufficiently close (but not equal) to $a$, we say “the limit of $f(x)$ as $x$ approaches $a$ is $L$” and write \[\lim_{x\to a}f(x)=L\]
or \[f(x)\to L\quad\text{as}\quad x\to a\]
According to the above definition, $x$ approaches $a$ but $x\neq a$, so the nonexistence or existence of $f(x)$ at $x=a$ or the value of $f(a)$ (if exists) has no bearing on the existence or on the value of ${\displaystyle \lim_{x\to a}f(x)}$. For example, if we define the function $g$ as \[g(x)=\begin{cases} then $g(x)$ and $f(x)=\frac{4x^{2}-4}{2x-2}$ defined at the beginning of this section are basically the same except when $x=1$ (see Figure 2(a) and (b)) \[g(x)=2x+2,\qquad(\text{if } x\neq1)\]
therefore \[\lim_{x\to1}g(x)=4.\]
Figure 2: As we can see $f(x)=g(x)$ except when $x=1$, and ${\displaystyle \lim_{x\to1}f(x)=\lim_{x\to1}g(x)=4.}$ For now to evaluate the limits, we use numerical and graphical approaches. In the previous examples, we used a calculator/computer to numerically evaluate the values of the given function $f(x)$ for $x$ near the given point. However, in some cases, computers may give false results. Here is an example of such situations.
The function \[f(x)=\frac{1-\sqrt{1+x^{6}}}{x^{6}}\]
is not defined when $x=0$. Let’s construct a table to list the values of $f(x)$ for several values of $x$ near $0$. From this table, we may conclude that \[ \lim_{x\to0}\frac{1-\sqrt{1+x^{6}}}{x^{6}}=-0.5\]
We might be tempted to choose some values of $x$ closer to $0$. Let’s try it out. The values in the above table are given by WolframAlpha.com (see the following figure). If you use a calculator, you might get a different value, but eventually, you will get $0$ if you make $x$ sufficiently close to zero. Do these calculations show us the limit is $0$ instead of $-0.5$? Let’s graph this function (see the following figure). Again it seems that the limit is $-0.5$. Let’s zoom in and graph this function again for values of $x$ closer to $0$. What is the reason for this strange behavior? This behavior originates from the fact that calculators and computers retain only a fixed number of digits during a calculation. For example, if a calculator stores only 4 significant digits, then 0.34246 and 0.34254 are both stored as 0.3425. In this specific example, when $x$ is very close to $0$, $\sqrt{1+x^{6}}$ is so close to 1 that the computer cannot distinguish between them. This undesirable effect is called “loss of significance.” It almost always occurs when subtracting two nearly equal numbers. Ways to avoid loss of significance are studied in numerical methods. Here, we can multiply both the numerator and the denominator by the conjugate of the numerator (See the Section on Rationalizing Binomial Denominators). \begin{align*} Note that \[y=\frac{1-\sqrt{1+x^{6}}}{x^{6}}\qquad\text{and}\qquad y=-\frac{1}{1+\sqrt{1+x^{6}}}\]
are equal except when $x=0$ because the first one is not defined for $x=0$ but the second one is. The following table lists the values of $y=-\frac{1}{1+\sqrt{1+x^{6}}}$ for several points approaching $x=0$. Calculations with WolframAlpha.com and the graph of $y=-\frac{1}{1+\sqrt{1+x^{6}}}$ are shown below. Now let’s consider the sign function $y=\text{sgn}(x)$ introduced in the Section on Piecewise-Defined Functions. Let the sign function be defined by Find ${\displaystyle \lim_{x\to0}\text{sgn}(x)}$. The graph of this function is shown in the following figure . When $x$ approaches $0$ through positive numbers, $\text{sgn}(x)$ approaches $1$ [although $\text{sgn}(x)=1$ for $x>0$, we still say $\text{sgn}(x)$ approaches $1$]. When $x$ approaches $0$ through negative numbers, $\text{sgn}(x)$ approaches $-1$. Therefore, there is no single number that $\text{sgn}(x)$ approaches as $x$ approaches $0$ from either side. Therefore $\lim_{x\to0}\text{sgn}(x)$ does not exist. In general, the limit of $f(x)$ as $x$ approaches a number $a$ (if exists) is unique, because for all $x$ near $a$, $f(x)$ cannot be near two different numbers at the same time.
\frac{4x^{2}-4}{2x-2} & \text{if }x\neq1\\
3 & \text{if }x=1
\end{cases}
\]

(a) Graph of $f(x)=\dfrac{4x^{2}-4}{2x-2}$
(b) Graph of $g(x)$ defined above
When Numerical Approach Fails
Read more on when computers may give false answers
Show Less


Figure 6: Calculations with WolframAlpha

Figure 7: Graph of $y=\dfrac{1-\sqrt{1+x^{6}}}{x^{6}}$ when $-3\leq x\leq 3$
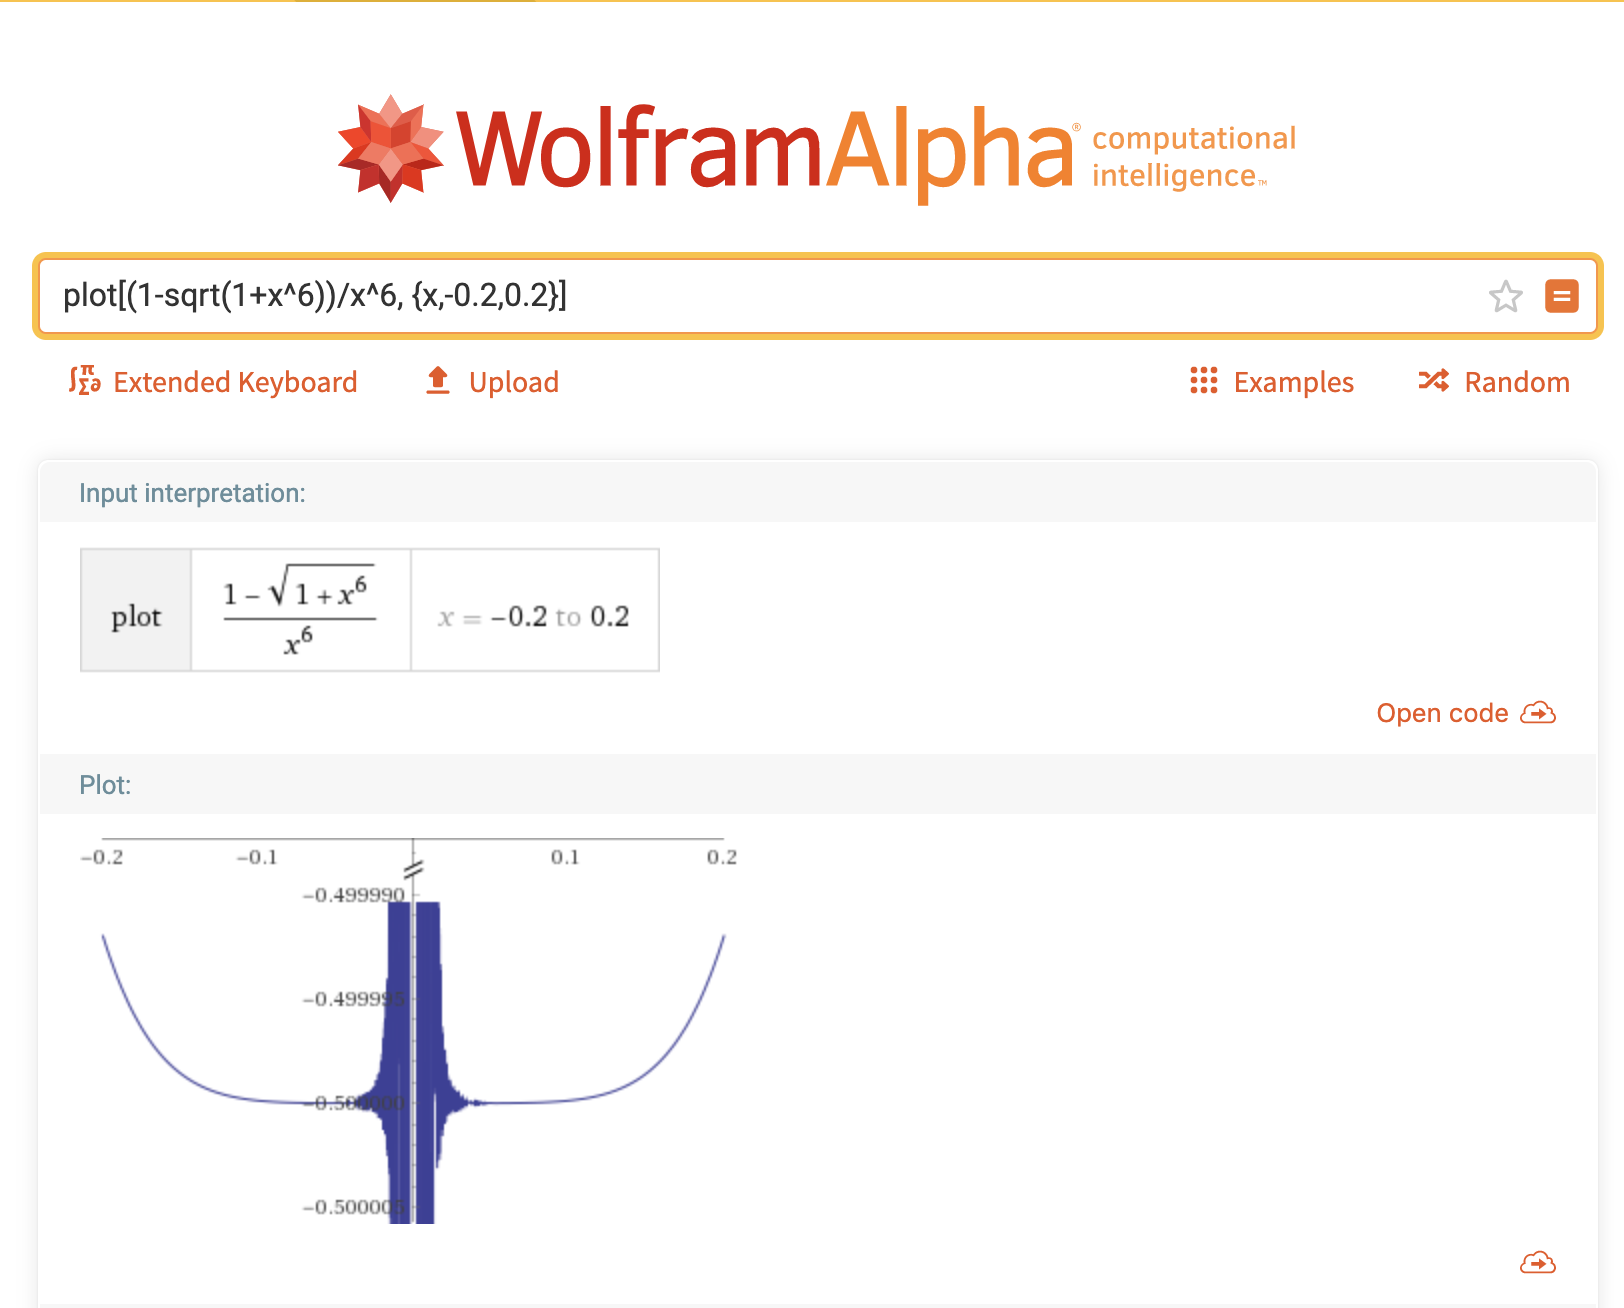
Figure 8: Graph of $y=\dfrac{1-\sqrt{1+x^{6}}}{x^{6}}$ for $-0.2\leq x\leq 0.2$
\frac{1-\sqrt{1+x^{6}}}{x^{6}} & =\frac{1-\sqrt{1+x^{6}}}{x^{6}}\frac{1+\sqrt{1+x^{6}}}{1+\sqrt{1+x^{6}}}\\
& =\frac{1-\left(\sqrt{1+x^{6}}\right)^{2}}{x^{6}\left(1+\sqrt{1+x^{6}}\right)}\\
& =\frac{1-(1+x^{6})}{x^{6}\left(1+\sqrt{1+x^{6}}\right)}\\
& =\frac{-\cancel{x^{6}}}{\cancel{x^{6}}(1+\sqrt{1+x^{6}})}\\
& =-\frac{1}{1+\sqrt{1+x^{6}}}
\end{align*}
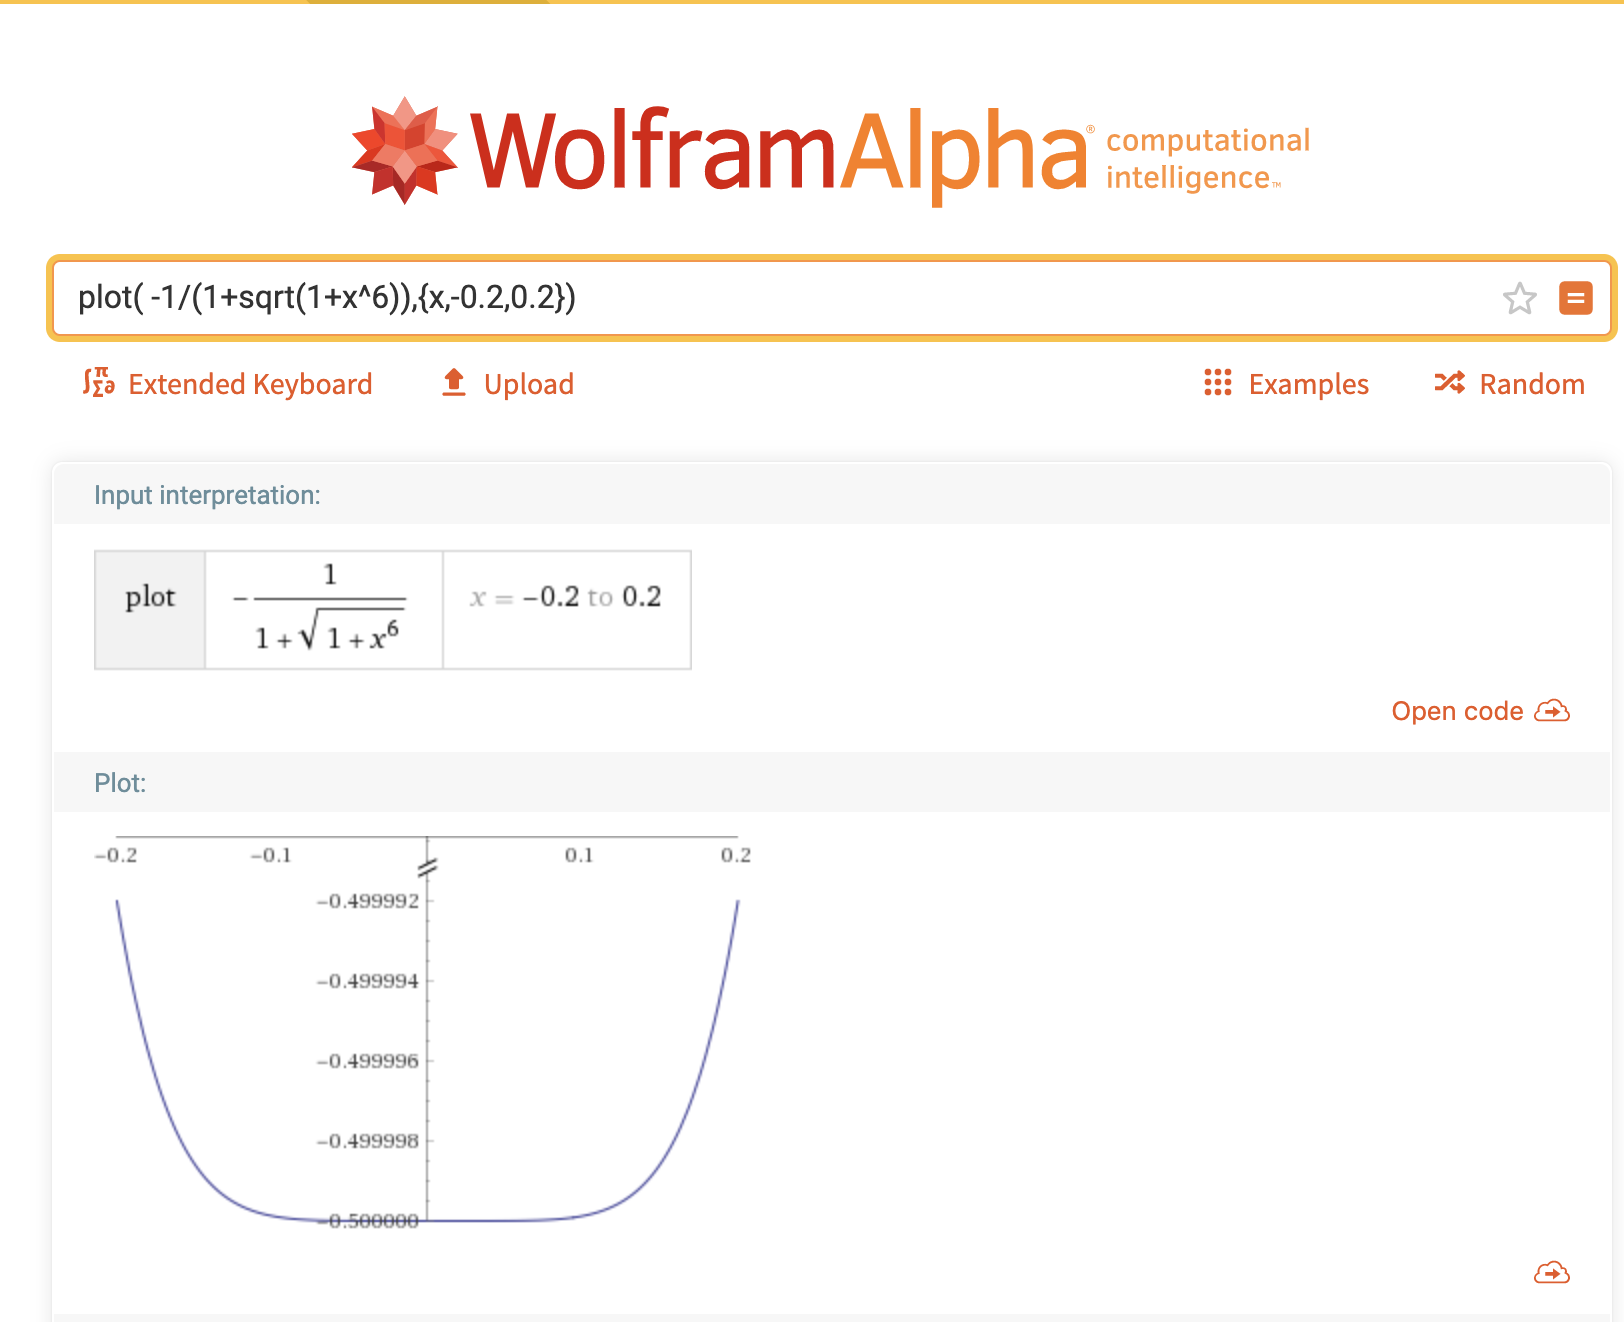
Figure 9
Uniqueness of a Limit

Figure 10: Graph of $y=\text{sgn}(x)$


